
Understanding your business’s performance is crucial, especially when you need to consolidate data for quick decision-making. If you’re navigating the complexities of assembling a comprehensive data view, it might be time to explore solutions in the “Power BI vs. Tableau” debate. These platforms are at the forefront of business intelligence (BI), data visualization, and analytical reporting, providing a cohesive platform for your data, fostering insightful analysis, and driving business growth.
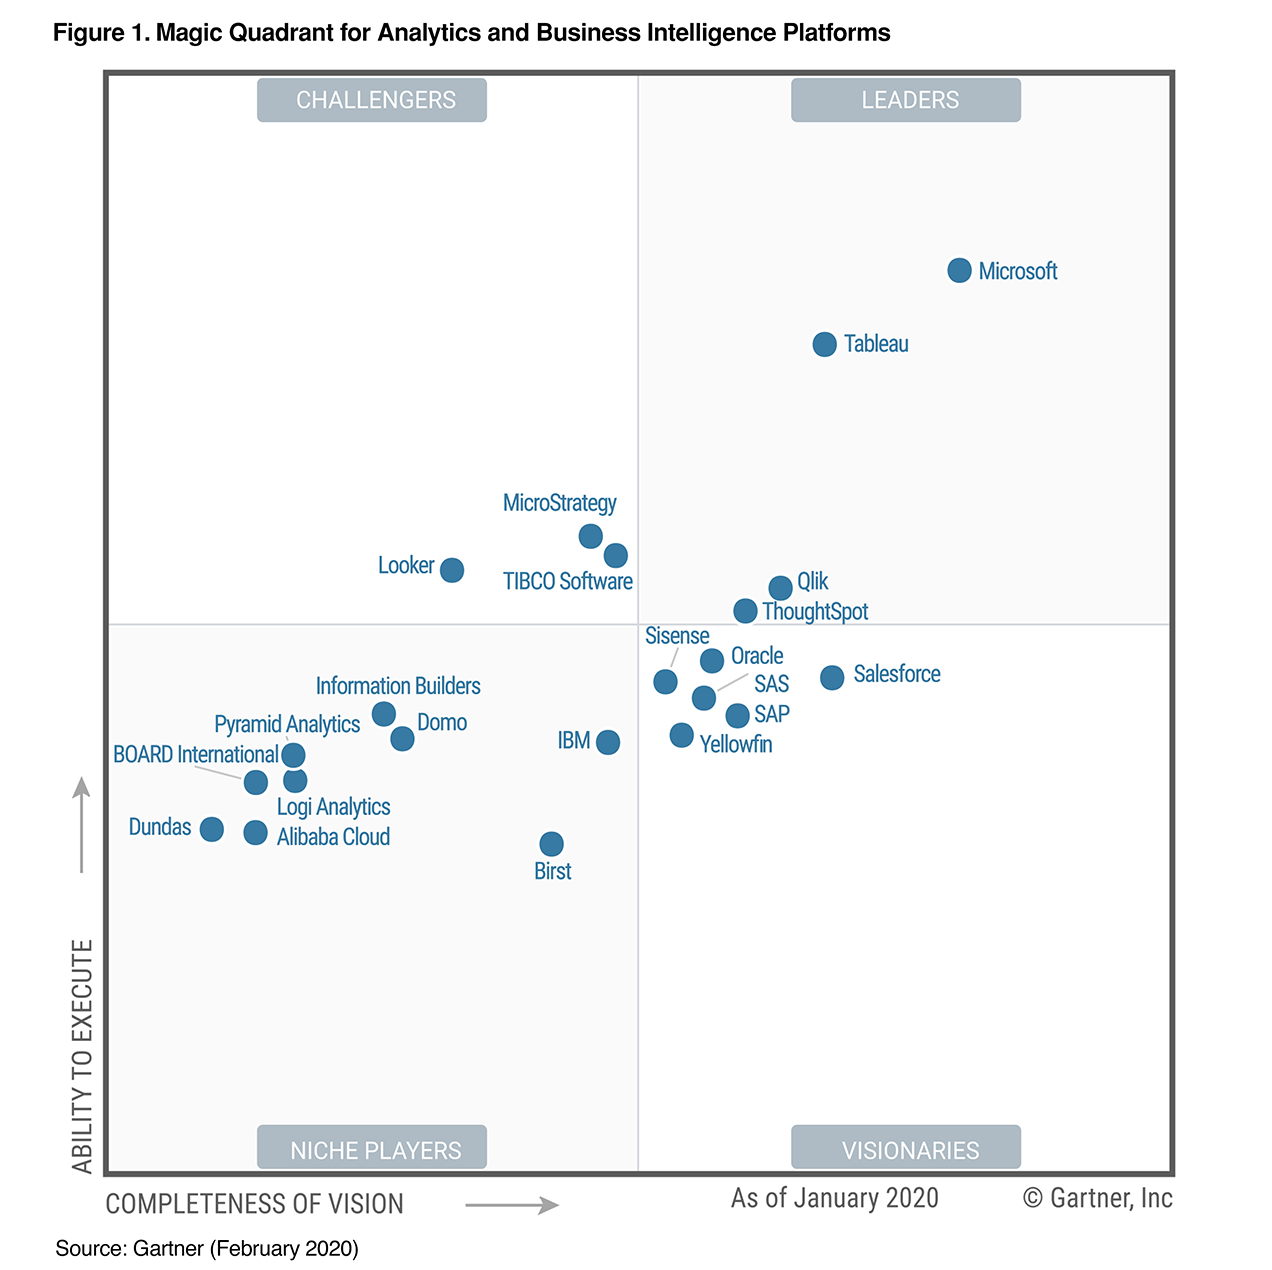
The BI and analytics domain offers a spectrum of reliable software choices, whether for creating dynamic visualizations or managing extensive data warehouses. Your selection should align with your existing business systems and infrastructure. Opting for the right tool, like Power BI or Tableau, can significantly leverage your data for strategic decisions. These tools are distinguished leaders in the analytics and business intelligence field, as illustrated by their positions in the Gartner Magic Quadrant, underscoring their effectiveness and industry trust.
Both Power BI and Tableau excel in data visualization while offering less emphasis on data modeling and management. These tools bring distinct advantages and limitations, catering to varied business requirements. Since what suits one organization might not align with another, it’s crucial to understand that investing in BI and data visualization software is a significant commitment. Such an investment has the potential to transform how you handle business data and make strategic decisions, underscoring the importance of thorough research before making a purchase.
To assist you in making an informed decision, we offer a comparative analysis of Power BI vs. Tableau, focusing on aspects like cost, functionality, and user adoption rates. This comparison aims to provide insights into what each platform offers, helping you determine which BI tool aligns best with your organization’s needs and user preferences before you invest.
All About Tableau
Tableau’s mission, “help people see and understand data,” underpins its status as one of the most rapidly expanding tools in data visualization. For over ten years, Tableau has committed to delivering interactive and user-friendly visualizations and data exploration tools tailored for business users. Renowned for its simplicity and speed, Tableau empowers users to delve into data and craft dashboards without requiring any coding skills.
Widely adopted across various sectors, Tableau enhances data connectivity, visualization, and sharing, ensuring a fluid experience across numerous devices and locations, from desktops to iPads. Offering an array of products and versatile deployment options, Tableau enables business users to opt for a subscription license, which they can then deploy on the cloud or on-premise servers, aligning with their specific needs and preferences.
The primary Tableau products available include:
- Tableau Desktop
This tool allows the creation of interactive workbooks and dashboards, transforming extensive data into comprehensible visual formats like graphs and charts. It’s designed for ease of use, enabling users to convey data stories effectively. - Tableau Server
This platform lets users publish, share, and manage Tableau Desktop projects, offering both live connections and data extracts. It supports over 100 data sources and facilitates the secure dissemination of interactive workbooks, enhancing collaboration and informed decision-making among the right stakeholders - Tableau Online
As a fully cloud-hosted analytics solution, Tableau Online permits the creation and sharing of interactive workbooks and dashboards through a web browser or mobile app, eliminating the need for physical hardware or server management. It connects seamlessly to cloud databases and ensures secure, anywhere access to data analytics.
Tableau has a strong community of forums and user groups to help you learn the system, answer questions, and connect with other users. Although Tableau has remarkable visualization capabilities and a user-friendly interface for non-technical users, the system is considered to have a learning curve for non-analytical users and the technical team that will support it. Tableau is also well-known for its high cost and inflexible pricing. Due to the cost of the system and training, it is primarily used by large enterprises like PepsiCo and ExxonMobil.
Pros of Tableau:
- Advanced Data Visualization: Offers powerful and agile visualization capabilities, enabling users to transform complex data into insightful visuals.
- Performance Efficiency: Exhibits high speed and performance, crucial for handling and analyzing large data sets swiftly.
- Intuitive User Experience: Features user-friendly drag-and-drop functionality, simplifying the data analysis process.
- Scalable Data Handling: Capable of managing vast quantities of data from diverse sources effectively.
- Mobile Adaptability: Provides flexibility, allowing users to access and interact with data on various mobile devices.
- Extensive Community Support: Benefits from a large and active user community, offering a wealth of resources, support, and shared knowledge.
Cons of Tableau:
- Significant Costs: Involves high expenses related to software acquisition and implementation, which might be prohibitive for some organizations.
- IT Dependence: Requires ongoing IT involvement for maintenance and management, which could limit autonomy for non-technical users.
- Limited BI Management: Falls short in offering comprehensive business intelligence data management, organization, and governance.
- Steep Learning Curve: Presents challenges for non-analysts, who may find the platform complex and difficult to master.
- Restricted Report Automation: Non-administrative users face limitations in automating and scheduling reports, affecting operational efficiency.
- Update Pace: The frequency of releasing new features and updates is considered slow, which may hinder staying abreast of the latest trends and tools in data analysis.
All About Power BI
Power BI is a robust business analytics service designed to enable seamless connection and visualization of data on a comprehensive, scalable platform. Its goal is to offer dynamic visualizations and business intelligence tools through a user-friendly interface, empowering end-users to create their own dashboards.
Recognized as one of the top BI solutions for small and medium-sized businesses, Power BI stands out for its affordability and rapid deployment, facilitating collaboration, publication, and data consumption.
Regarding setup, Power BI offers three distinctive deployment choices:
- Power BI Desktop
This complimentary tool enables data preparation, modeling, and visualization creation. Integrated into all Office 365 plans, Power BI Desktop is available for free download and use. However, most organizations may find the need to transition to paid versions for access to enhanced features and capabilities, such as the ability to view and share reports. - Power BI Pro
This cloud-based service facilitates report editing and collaborative efforts. Offering a more comprehensive set of BI functionalities than its desktop counterpart, the Pro version allows users to create, publish, and disseminate data visualizations and reports. Subscribers can utilize app workspaces for collaborative dashboard and report development with team members. - Power BI Premium
Catering to advanced analytics and enterprise-scale reporting, Power BI Premium allocates dedicated cloud compute and storage resources rather than a per-user license. Pricing is based on the required storage space and processing power. Enterprises opting for Power BI Premium typically aim to manage larger data sets, advanced administrative and deployment controls, and the extensive distribution of content.
Pros of Microsoft Power BI:
- Cost-Effective: Notably affordable, with lower licensing and training expenses compared to other BI tools.
- User-Friendly Interface: Utilizes a familiar Excel-like environment, making it accessible for users accustomed to Microsoft products.
- Advanced Visualization: Offers robust visualization tools that allow for the creation of comprehensive and interactive data reports.
- Regular Updates: Benefits from Microsoft’s consistent rollout of new features and updates, keeping the tool current and innovative.
- Extensive Learning Materials: A wealth of online resources is available, facilitating user education and proficiency in the tool.
- Collaborative Features: Enables straightforward sharing of reports and dashboards, enhancing collaboration across teams.
- Mobile Accessibility: Provides support for mobile devices, allowing users to access and interact with data on the go.
- Microsoft Ecosystem Integration: Seamlessly integrates with other Microsoft products, offering a cohesive and efficient working environment.
Cons of Microsoft Power BI:
- Steep Learning Curve: While powerful, the extensive functionality can be daunting for new users, potentially requiring a more substantial learning investment.
- Complex Data Modeling: The data modeling aspects can be intricate, often necessitating advanced technical skills or resources.
- Performance Issues: It may exhibit performance lags with large datasets unless integrated with a dedicated data warehouse to handle the volume efficiently.
- Limited Data Management: Without linking to a comprehensive BI platform, data management and consolidation features can feel constrained, affecting the tool’s versatility.
Maximize Your Data Insights: Power BI vs. Tableau
Power BI and Tableau excel in transforming data into compelling visualizations, yet their true power is unlocked with robust data modeling and management. These platforms are renowned for their analytical reporting and mobile accessibility, yet they require a solid foundation for tasks such as data extraction, transformation, and loading. Integrating a data warehouse with Power BI or Tableau is essential for centralizing and governing your data, ensuring it is organized for effective analytical reporting and visualization.
Fortunately, the integration of a data warehouse with these tools is less complex than it seems. Advanced data warehousing solutions seamlessly integrate with ERP systems like Microsoft Dynamics, providing plug-and-play options that support efficient customization. This streamlined approach not only eases data management but also bolsters the impact of your data analytics and visualization efforts.
Discover the advantages of data warehouse automation and establish a robust foundation for your analytics solutions with Power BI vs. Tableau.
Guarantee a Successful BI Implementation
Comparison: Power BI vs. Tableau
Now that you’ve gained a deeper insight into both products, we present a detailed comparison of their costs and functionalities. This comprehensive analysis is designed to assist you in your software selection process, ensuring you make an informed decision that aligns with your needs and objectives.
| COST |
|
Power BI: Power BI Desktop: Free Power BI Pro: $9.99/user/month Power BI Premium: $4,999/month |
|
Tableau: Tableau Desktop Personal Edition: $35/month/user Tableau Desktop Professional Edition: $70/month/user Tableau Server On-Premises or Public Cloud* $35/month/user Tableau Online Fully Hosted* $42/USD/month/user *Tableau Desktop Professional is required to publish workbooks and data sources. |
| FEATURES |
Power BI:
|
Tableau:
|
| DATA INTEGRATION |
|
Power BI: Hundreds of data source connections are available, including any SQL, Azure SQL, or Spark database and Excel or CSV data file. |
|
Tableau: Out-of-the-box integrations with the most common data source types and operational systems, with the ability to create custom data connections. |
| DEPLOYMENT |
|
Power BI: Cloud-based service |
|
Tableau: Available on-premise and in the cloud. |
| USER INTERFACE |
|
Power BI: Simple, intuitive interface built on the familiar Microsoft platform that’s quick to learn and easy to use. |
|
Tableau: Modern interface with self-service features but requires more training. |
| CUSTOMER PROFILE |
|
Power BI: Companies of all sizes including small-to-medium businesses (SMB), and medium-to-large business (MLB) markets. |
|
Tableau: Primarily larger companies. |
| PRODUCT COMMUNITY |
|
Power BI: Strong user group and partner community. |
|
Tableau: Strong user group and partner community. |
Elevate Your Data Insights with Tigunia
Unlock the full potential of your data with Tigunia’s expert guidance. If the array of data visualization solutions like Power BI vs. Tableau leaves you perplexed or uncertain about which one to choose, let Tigunia assist you. Our seasoned team, specializing in business intelligence, is deeply immersed in data management, reporting, and visualization. We’re here to help you evaluate your specific needs and identify the most suitable solution for your organization.
While we are a Microsoft-centric team, catering primarily to small and medium-sized enterprises, our experience suggests that Power BI often emerges as the standout choice. Power BI excels as an affordable and scalable tool, enhancing your data analytics and reporting capabilities. It equips you with essential resources for self-service reporting, in-depth data analysis, and informed decision-making. Discover the impact of Power BI on your business with our concise, 30-minute demo. Experience how Power BI can streamline your operations, enrich customer interactions, empower your employees, and positively influence your financial results.